GeoMaestro
Using the graphic tool
Presentation
Basics
Ev scene management
Display options
Projections
Channels management
Presentation
The graphic tool (generally called "main GUI" in this manual) is more than a simple tool: it's a full interface to the GeoMaestro system, designed to be used interactively along with console commands and programs calls. When you write a .kp page containing the main GUI (KeyKit root menu page > write), or when you use the [save] button of the wrapper tool (see below), the state of the whole GeoMaestro environment (Ev scene, parameters settings, commands histories and LOG, RL array and registered global variables) is saved, so that the .kp and .gmt formats are the best ways to save your composition between two KeyKit sessions (see here for details). This also means that if you open more than one instance of the tool, strange behaviours may happen (although it can be interesting in some very specific cases). See here for more.
But you can also simply use this tool as a toy to produce sound ! I think the best way to understand the principles of GeoMaetro is just to play with the tool. Later on, you may be interested in going into some programming if you have more ambitious purposes. See the tutorials for examples, hints and tips.
You should have the graphic tool available from your Tools1 menu under the name "GM>> Main GUI (alone)"
Note that you can also access the main GUI from a wrapper tool (in the Tools1 menu under the name "GM>> Wrapper (2 GUIs)") which opens at the same time (and in the same place !) the main GUI and the Compositor tool; use the macro gTT at the console to toggle between the two tools, or click on the [toggle] button
The [save] and [read] buttons of the wrapper tool manage *.gmt files; it is recommended to use this format to save and restore your current work, although you can also do that by writing and reading KeyKit pages. Be aware that a KeyKit bug makes it impossible to save a same page indefinitely: see here for details
Here is how it looks like:
(The image is clickable: if you click on a button, you will be brought were it's talked about. But this is a presentation better than a reference document, so I strongly recommend that you read at least once everything here from the beginning to the end)
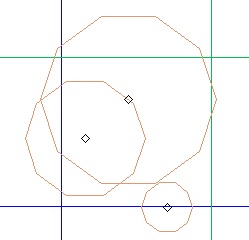
The left area is used to display a part of the event scene, along with an optional grid. It can also display any geometrical element you previously defined in a global variable, such as points, segments or circles. And it can also display the geometrical elements associated with a projector (more of this below)
All black symbols are events (which get red if they are selected), and each type of symbol refers to a particular channel, at least for the 20 first ones (remember, GeoMaestro channel are not only MIDI channels, so you can have more than 16 ones)
The other objects displayed in this snapshot are not part of the scene. They are here because I used the [display] button and ask to see them. On this example you can see the axes and grid, a few circles and segments and also some lines showing the way two selected events are projected. See display options for more about that.
The right area can be divided in three functionnal parts: the upper one is always present and is used to select the mouse mode and the selection mode, and also to performs actions on the current selection. The bottom part is also always here; it is used to set the display options. The middle part (just above and right to the [REDRAW] button) can vary, if you click on one of the three smallest buttons; it has three configurations: one to manage the Evscene (save or read *.ev files, clear everything, activate or inactivate specific events), another one to manipulate projections ([pj]) and produce phrases or MIDI files, and the last one to set the channels parameters ([fn]).
Here is the way it looks for the second and third configurations:
Basics
The main operations are made using the mouse. Each mouse button can be affected a mode, using the two upper-right menu buttons (in the example above they show "zoom" for the left button and "infos" for the right one). Moreover, you can also use the square button at the right to associate modes to combinations of control keys and mouse clicks: Norm (normal), Ctrl, Shift and Ctrl-^ (Ctrl+Shift). This is exactly the system used by KeyKit's Group Tool.
Here's the menu for mouse modes (the image is clickable):
infos lets you define a rectangular area then print (in the console) a description of all events and geometrical objects it contains. Note that only active events are displayed (See reference on data structures to see what is an active event. But never mind: if you don't care about that, all events will always stay active !). A circle is "located" by its center, a segment by either one of its extremities.
zoom gets you more or less inside the area you define (rather exactly if you draw a square, otherwise it's ajusted to keep the x/y ratio, so the circles always looks circular). If you simply click once somewhere, this sets the new center of the window. If you click once close enough to a point, a circle center, the extremity of a segment, or an event, then the center of the window will be set exactly to the coordinates of that point. This feature is very useful to set a rotation center.
move around lets you do exactly that: move around the scene (if the motion is slow and ugly, you can either get rid of the grid with the [grid] button , or hide projections with [proj], or use the FastRedraw mode, very smooth and pleasant to use but somewhat messy at times... just try it)
with new point when you click anywhere in the scene area a window appears and ask for a GLOBAL variable name (a Name, then). If you give one, it will become a new point and will be immediately displayed as a blue circle.
new circle: same thing with a circle (drag the mouse to set the radius)
new event : same thing with an event... so this time you are asked a nodur (that is: a phrase) and a channel number. You must give both of them in the same line, with a "#" in between. Note that you can give any kind of valid KeyKit expressions as long as the first one returns a phrase value and the second one an integer value (and don't forget the "#" !). So if you want to define a nodur with a complicated definition, just type it in the console and store it into a global variable. You'll just have to give the variable, then (for exemple: Snarf). If you only give a nodur, the channel number will be the current channel (as defined in the [fn] menu). If you simply type "*", the nodur will be the last chunk in Recorded, as used in the Group Tool, with a 2b space (to have another space value, just enter it, an integer, as the nodur value), and the channel will be the current channel.
Note that it is often simpler and faster to use the "Snarf to event", "Conph to event" or "Recorded to event" modes.
Snarf to event : this is a fast way to paste the Snarf value as a new event. You don't have to type anything, simply click in the graphic area. It is the same as using "new event" and typing "Snarf", except that if you click on an existing event (or alias), instead of having a new event created, the nodur of the existing one is changed. (If you want to be able to stack different events at the same place using this mode, set Snarf2Ev_Replace to 0; you can also use the macro tSE to toggle this parameter on and off)
Conph to event : same thing as previously; instead of Snarf, we use Conph, which is the last phrase that was sent to MIDI out from the console. You can use this mode to type a phrase at the console and paste it immediately as a new event
Recorded to event : this time, we use the Recorded buffer (Recsched must be set to 1; see KeyKit documentation for more); you can use this mode to get a phrase from a MIDI keyboard and paste it as a new event. The last bunch of notes in Recorded is separated from the previous notes by a silence lasting more than RecordedSpace; by default, RecordedSpace is 2b (its value is set in intialisations.k)
pick & drag: lets you move an event or an object by simply clicking on it and dragging the mouse; to move a circle, pick its center; to move a segment, pick one of its extremities. If PickAndDragExtremities is set to 0, the whole segment is dragged; if it is set to 1, only the extremity you pick is dragged. Use the macro tPDS to toggle PickAndDragExtremities value.
selection: selected events get red, selected points get red with an inner circle. There are three modes for selecting everything, plus three other modes for selecting only events, or only non-event objects, or only events from the current channel. You choose the one you want from the mode menubutton (in the example image above, it shows "plus"):
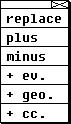
... their names say all. Just try and see !
By the way, the [!DELETE!] button kills the selected events. In the early times, there was no undo, that's why we have "!DELETE!" instead of "delete"... but now you can [UNDO] the last undoable operation (the console issues a message everytime such an operation is performed), and you can also [STO]re the current state if you want to be able to go back to it with UNDO (UNDO twice to go back before a STOred state, which will then be erased)
The UNDO feature is very useful, but it can also be time and memory consuming. So a set of parameters is provided to limit its performances, or even to disable it completely; their interest depends on the kind of work you're doing with the GUI. Here they are:
NoUNDO (when set to 1, UNDO is completely disabled)
DispUNDO (when set to 0, display operations are removed from the UNDO capabilities)
LigneUNDO (when set to 0, operations on lignes can not be UNDO-ne)
EvUNDO (when set to 0, operations on the event scene can not be UNDO-ne)
See here for a detailed discussion about time issues in the GUI.
move selection: with the mouse you can draw a segment anywhere in the scene area: it represents the vector used for translating the selection. When you stop dragging the mouse, the translation is done. If you simply click once, without dragging, you can directly give the numeric values for the vector's coordinates
rotate selection: Important: the rotation will be done around the center of the area, so you have to set this center first. To do that, use the "zoom" mode and simply click once on the point you want to be the area center (you can click anywhere, but if you click close enough to an event or a point, its coordinates will precisely define the new center. Useful to scale circles)
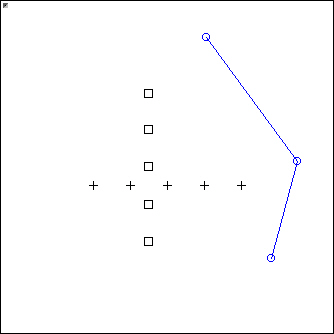
Now for the rotation: if you click once, you're asked for an angle value and, if you give one, for a scaling factor (by default 1). As previously, you can also drag the mouse; it's a bit complicated to explain, so here is a picture (two events are selected here):
...as you can see, there's a blue target-like thingy in the middle of the scene area. It has two circles: one follows the mouse (its radius change) and the other doesn't change (it was defined when you first clicked somehere). There's also the little segment going from the center to the mouse. When you stop dragging the mouse, the selection is rotated according to the motion of the segment, and it is also scaled according to the ratio between the two circles diameters (so that if the last one is inside the first one, it's scaled down). Try it to get the feeling, it's easier to understand than to explain !
For the example above, you would get that in the end:
copy(m) selection works in the same way as move selection, but the selection stays in place and a copy is created according to the vector you draw. Since the selection doesn't change at all, you can use it several times in all directions.
If there are geometrical objects in the selection, you will be asked by pop-up windows to give names to their copies (if you simply press RETURN, the object will not be copied). This can be very tedious is there is a lot of objects to copy, since you will have to give a name for each of them; so you can instead give a string starting with "*" instead of a name: all copies will have the names of the originals, with the rest of the string appended at the beginning. You will have to do this for each different type of objects (points, circle, segments and pistes). Type simply "*" if you don't want a specific type of objects to be copied.
Note: if among the objects to be copied some belong to arrays, make sure before using the "*" syntax that the new names are also referring to arrays. For example, a point Po[15] with a copy name "*P2_" will be copied as P2_Po[15]: this will fail is P2_Po has not previously been defined as an array: P2_Po=[]
copy(r) selection same thing as above , this time with respect to rotate selection.
While we are on selection stuff, let's talk about the two buttons below the [!DELETE!] one (we'll go back to the mouse button menu a bit later on):
The [--->] button is used to transfert selected data from a format to another, and the second button let you choose among different transfert modes:
points to piste: selected points are used to create a piste (that is, an ordered collection of points). You must give a name to the piste. If it is an already existing piste, the new points are added to it. Points are always arranged in the order they got initialized in the tool, so if you want to define a specific order (this is very likely if the piste is going to be used as an argument for a projector call), just use the [display] button once to remove the points from the tool, then use it another time to display them again, and this time type their names in the order you want them to have in the piste.
events to scene: selected events are copied to a new scene, or added to an existing one. You must give a name for the scene. Channel attributes are kept identical, so you may want to change them before (use the [operation] button)
points to events: here we use each selected point as coordinates for a new event. You have to give a channel and a nodur for each newly created event, in the same way as in the "new event" mouse mode.
events to points: here we use the coordinates of each selected event to create a new point. You have to give a name for each new point.
events to piste: the coordinates of the selected events are used to create a piste, or to add points to a new one.
piste to events: for each selected piste, you can give a command line that will detail how the points in the piste will give birth to events. This command will be executed for each value of global variable I_ in the set of indexes. You can use C_ to set the channel, N_ the nodur and S_ the selection flag (you can also use the variables X_ and Y_ which hold the event position); for example, the command
C_= 2; N_= (X_>0?'a':'e'); S_= ((I_%2) == 0)
... will create an event in channel 2 for each point in the piste; the event nodur will depend on the sign of its x-position; among these events, the ones corresponding to an even index in the piste will be selected. This works more or less in the same way as the [operation] button; see tutorial 7 for a comprehensive example.
Note that the selected objects or events are not deleted. It's more a kind of copy.
Back to the mouse button menu:
phrase to segment: here you can draw a segment, then you are prompted for a phrase. The phrase will be displayed along the segment, splitted in as many events as there are notes in it, and according to their time values. The non-notes MIDI messages in the phrase are ignored and forgotten. If as second argument you give a channel number, all events are affected to this channel: their previous channel values are overridden. You can also give an array for mapping channels (see example below) as second argument. If as last argument (second or third, since channel setting is optional) you give "auto", then the length of the segment will be arranged (keeping the starting point and the direction) so that it's corresponding to the length of the phrase (this depends directly on the value of the global variable CPCM... see the projectors stuff elsewhere in this manual)
The arguments must be separated by spaces or ";" or "#". No comma since it can be used inside an array (see channel mappings below)
Special syntax: instead of a phrase, type
$r to get the last chunk in Recorded (provided that you have Resched = 1).
$s to get Snarf (of course you can also simply say "Snarf" !)
$c to get the last phrase played at the console (this is the same as saying "Conph").
Examples of channels mapping:
Cmap1 = [1=3, 2=5, 15=10]
... here notes from MIDI channels 1, 2, 15 will be affected to GeoMaestro channels 3, 5 and 10. For all other notes, the MIDI channel will be the same as the GeoMaestro channel. You can use "Cmap1" or "[1=3, 2=5, 15=10]" as argument.
Cmap2 = [1=3, 2=5, 15=10, 3=0, 4=0, 5=0]
... same as above, but here the notes from MIDI channels 3 to 5 will be ignored
Note that the segment you just draw with the mouse is stored in the global variable PhS_, so that you can display it or use it as a parameter for a projection. It will be replaced if you do another phrase to segment, so if you intend to use it make a copy at the console ("SegAnyName = PhS_")
phrase to circle: same thing, along a circle. When you draw the circle, the segment starting from the center indicates were will be spotted the first note/event of the phrase. And a "auto" argument makes automatic ajustment of the radius so that the perimeter of the circle is corresponding to the length of the phrase.
The circle is temporarily stored in the global variable PhC_
hear ev/seg sends nodur to midi out; if you click on an event symbol, you'll hear its nodur, if you draw a segment with the mouse you'll hear Ecoute() performed on that segment. The GUI use the temporary global variables Ma and Mb to store the extremities of the segment. So if you liked the sound and want to keep these two points, copy them at the console (type A=Ma; B=Mb for example) BEFORE you use the "hear ev/seg" mode again ! Otherwise this information will be lost.
Rendering the segment as a ligne: you can use "Ma,Mb" as argument for the Ecoute projector (with the [--->] button): in that case when you [redo] the ligne it will use the current values for Ma and Mb. You can also use special shortcuts that make the GUI replace once for all Ma and Mb by their current values (so that [redo] don't change anything): "-" (or ">") stands for "Ma, Mb", while "<" stands for "Mb, Ma". See tutorial 1 for illustration
hear ev/cir: same as "hear ev/seg", with a circular support; this time EcouteC() is performed on the circle you draw. The GUI use the temporary global variables Mo and Mr to store the center and starting point of the circle.
Rendering the circle as a ligne: special shortcuts are the same as previously: "-" (or ">") does the projection clockwise, "<" projects the other way round.
define zone allows you to draw a rectangular area which will be refered to as a zone. The only interest of zones is to clearly separate different sets of events, which can be useful depending on the way you use GeoMaestro for composition. You are asked for an optional zone number, and any kind of information or name you may want to associate with that zone. If no number is given, one is automatically affected. The zone then appears like a rectangle with a small circle in one corner. If you do an infos request on the circle, the console will display the zone number (useful to know if you didn't give one) along with the info string, and you will be asked weither you want to change the info or keep it as it is.
Displaying zones: µn and -µn shows/hide zone number n, µ and -µ shows/hide all zones
Using zones: you can activate/desactivate all events in zone n by using the syntax µn as argument for the active/inactive buttons. This allows you to very easily manage independent sets of events in the same Ev scene. It also speeds up projection as you can desactivate events which wouldn't be heard anyway, for example because there are too far away from the supports.
Regions allow more powerful and sophisticated ways to handle specific geometrical area inside the Ev scene, but they are not directly available from the GUI (except in a couple of plug-in generators). See tutorial 3 for an example of region usage
dynamic segment: here you can create points linked by dynamic segments and easily connect them together to form lines or nets.
comments: this is the mode used to manage comment flags: boxes linked to a specific point in the Ev scene, where you can write any text you want (as long as it does not contain double quotes !). To create a comment flag, click to the point you want to comment, drag to the place you want the box to be, then release and type the text in the pop-up window. In this mode, you can also grab a boxe and move it. If you move it out of the window, the comment flag is deleted. Comments are part of the Ev array, so they are saved with the events scene.
When you zoom or move around the graphic area, the behaviour of the comments flags may seem a bit strange; let me explain here what is happening:
1) the segment you draw to connect the commented point to the box is always kept the same, weither you zoom in or out; and 2) if the box cannot be fully displayed, it is not displayed at all. So the motion of the commented point when zooming or moving around may make the comment disappear: it is not deleted ! You can have it back by moving again so that there's enough room for the box to appear, and then you can move the box to a new place if you want to.
The [C] button lets you toggle comments display on and off.
plug-in: this gives access to the currently selected plug-in (it is selected with the menu button just above the [display] button). So the action performed by the mouse depends on the plug-in. The idea is to allow you (the user) to write a short (or not so short!) code to program the mouse as you like. See advanced features for a detailled explanation of the way to do so.
A few plug-ins are provided as examples:
RandPick selects randoms events in a rectangular area (it's a selection tool)
EditScore is a tool to edit Csound scores in events
ModNodur lets you graphically set volume and duration for an event's nodur
Clavier is a fast way to set a nodur's pitch (see tutorial 2 for an example)
LSeqCopy makes it easy to repeat an event within the LSeq projector
RegRect and RegDisk define a rectangular or circular region called GenRegion in which you can for example use Hexagons to generate an hexagonal pattern of empty events (drag the mouse to draw a segment representing one side of the hexagonal seed).
AltClavier and AltInfos can be used to have another mapping for MIDI notes names (see lib/alt_tuning_utils.k for more)
ChooseDF is introduced here
DistMap is detailed here
EvToSnarf does what it says.
See the plug-in reference page for more.
show distortions: with this mode you can select an event and see how its nodur gets transformed with the distance (this depends on the way you did set the distortion functions). Click an event and drag the mouse so that you cover the distance you're interested in. When the mouse button is released, graphes are drawn that show the evolution of volume, duration, pitch and time offset along the distance, in both cases corresponding to the two possible side-positions of the event with respect to the support. Example:
... as you can see if you read the console, the green line is the volume (the clearer green one is the value of SILENCE) , the red line is the pitch and the blue one the duration (since this one is not restricted to values from 0 to 127, you can choose the scale by setting the parameter DURDISTSCALE, which by default is 1000)
The console also displays a set of related information: event's nodur, distortions functions applying to it, and correponding phrases for the given distance, at the left and at the right
angular distortion: with this mode you can select an event and see how its nodur gets transformed, at a given distance, according to the angle of its projection (again, this depends on the way you did set the distortion functions). Click an event and drag the mouse so that you cover the distance you're interested in. This time a circle is displayed: you also have to choose an angle. When the mouse button is released, graphes are drawn that show the evolution of volume, duration, pitch and time offset along the circle, starting at the angle you choosed. Again, the two possible side-positions of the event with respect to the support are shown.
hear distortions: as with the "show distortions" mode, click an event and drag to a distance: this time you will directly hear the distorted nodur. Actually, since two different distortion effects are associated to the same distance (because distortion also depends on the side of the event with respect to the support of projection), you can choose the one you want to hear by dragging to the left or to the right. But be careful not to be confused: geometrically, this has nothing to do with the "left" and "right" used when projecting on a support ! It is just an easy way to get the distorted nodurs... In GeoMaestro, directions do not have specific meanings: up or down, left or right, it's all the same as far as projections are concerned.
Ok, that's it for the mouse button menu !
There's one important and powerful button we have to see now: the [operation] button. It only works on the selected (red) events.
It asks for a valid KeyKit expression, evaluate it and redraw the tool. That's it. So it's very powerful, because you can ask for anything and transform or use the selection in an infinite number of ways.
Syntax: you have to use X_, Y_, C_ and N_ to represent the position, channel and nodur for each events in the selection (also: S_ represents the selection flag, A_ the activation flag, P_ the event's script, L_ the event's label and O_ the event's score).
For example, if you give "C_ = 4", all events in the selection will be attributed to channel 4.
Or if you type "Temp = X_; X_ = Y_; Y_= Temp" then the selection will be mirrored along the x=y axis. Etc, etc..
Also, because N_ is representing the nodurs, which are phrases, you can type "N_.vol = 127" to set the velocity of the events. It could be more complicated, like: "N_.vol = 127-10*X_"
And of course you can use all global variables you previously defined.
There's more: it's a bit subtle, but very useful. Here it is:
If what you typed starts with a ":", then what follows will be evaluated once to get the expression to use, then a second time to apply the result. Get it ?
Usage: that's mainly because you may want to do a very complicated operation on the selection. So the best way to do that is to use the console to define a string global variable that will contain the code for the operation. And then you give the name of this variable at the prompt.
Example: in the console, you type:
Formula = "if (C_==4) {X_=X_+1; Y_=0.1*N_.dur; transpose(N_,2)} else if (C_==2) transpose(N_,3)"
Now if you click on [operation] and, at the prompt, type:
:Formula
... the whole big thing will be evaluated on the selection.
You could actually write whole programs this way. But if that's what you're into, then it's better to have a look at the whole GeoMaestro set of functions and do everything at the console or in a text editor. There's much more to have fun with !
As an application to this feature, there's an history management for the [operation] button:
history is kept in array FKK
:n recalls expression indexed n (it's the same as typing FKK[n] as an expression)
::recalls the last one
:? lists the history at the console
(Note: as for any array, you can edit FKK with the console command Notepad(FKK) if you properly set the global variables NOTEPAD1 and NOTEPAD2 which are used to call a text editor from the shell. See installation for details)
Ev scene management
As I said before, three different sets of buttons can appear in the middle section. We are now interested in the first one, the one you get by clicking on the [ev] button:
[active] and [inactive] buttons are used to decide which part of the event scene is to be displayed. They ask for a valid KeyKit test on the variables X_,Y_,C_,N_and S_, L_, P_, O_ in the same principle as the [operation] button. (here, S_ is the selection flag: it's 1 if the event is selected, 0 or "" otherwise)
If you give C_==2 on "inactive", events affected to channel 2 will be removed from the display. They are not deleted, but you can't select them, modify them nor hear them until they're activated again. S_==1 would affect only selected events, (S_==1)&&(C_==2)would affect selected events from channel 2, etc...
As for [operation], there's an history to the "active/inactive" tests: (It is kept in array FIF)
:FIF[n])
:: recalls the last test
:? lists the history at the console
(note that if you want to give as a test a string global variable containing the test itself, you also need a ":" , exactly as the [operation] button syntax. Example: if Test="C_==2", you can give :Testas a parameter)
[add scene] adds another scene (you have to give its name) to the Ev. There's no difference in structure between a scene and the Ev array (to say it another way, the Ev array is merely a scene); but the Ev scene is the only active scene. Other scenes are simply stored for later recall. To save a scene on a file, you must either make it the current Ev scene (by using the [new] and the [add scene] buttons) then use the [write .ev] button, or directly use the proper command at the console (the command is SaveScene(). See the functions reference for more details)
The [new], [read .ev] and [write .ev] are self-explanatory. Just have a look at the reference on data structures to understand clearly what are the Ev events. The most important thing is that there's only one scene at a same time in GeoMaestro. You can open many tools, but they will all work on the same scene. Any event selected in one tool will be selected in the others, etc... Note that when a tool is dumped (if you write a page which contains it), the events are dumped with it. So if you're working on several scenes, or with several tools on different pages, be careful when you restore a page: it will erase your current Ev !
The [*] button toggles between different display modes for events having the same coordinates. By default, you only see one symbol per channel on a given point, so it is not easy (well, let's say it's impossible !) to select only one from a bunch of events at the same point with the mouse. One workaround would be to select the whole "stack" then use the operation button with a test expression to unselect the ones you don't want. For example:
if ((C_ != 3) && (N_ != 'a')) S_=0
would only keep selected the event(s) on channel 3 whose nodur is 'a'. But this is quite tedious (I detailed this example here because it is a powerful way of creating a very specific selection from a broad one, good to keep in mind)
So the [*] button lets you see aliases for stacked events: they are blue symbols, one per event, appearing beside the stack. Here's an example:
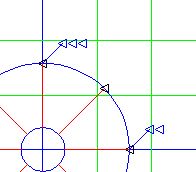
... here the three triangles on the circle are actually refering to six events, as you can see from the aliases.
Selection operations can be performed on the aliases, making it possible to extract an event from the stack or modify it in any possible way. You can also hear an event's nodur from its alias.
The [C] button is used to toggle comments on and off. See the "comment" mouse mode for more.
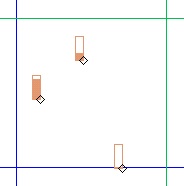
The [A] button displays in turn different symbolic representations of the event's nodur properties. You can visualize nodurs' durations (in two different ways), volume and pitches:
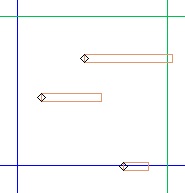 ... here you can see the event's durations as horizontal rectangles, like they would appear in the usual MIDI piano-roll representation
 ... here you have the durations as "circular" area, since there is no specific direction in GeoMaestro. In both cases,
 CPCM is used for calculation, so that the circle radius (or the rectangle length) is consistent with the grid (on the pictures, the square side is one CPCM long, that is, by default, one second). Of course if you make projections with a duration parameter different from 0, the display will not be coherent any more (neither as the grid).
 ... here you see the volumes. A full box represents a volume (velocity) of 127, while an empty one represents 0
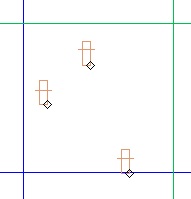 ... here are the pitches, or MIDI notes (top is 127, bottom is 0). If the nodur is more complex than a single note, the pitch is not displayed and a cross appear in the corresponding box.
Note on full event display customization: (you can skip this section at first)
Use the string variable DisplayedText (whose default value is "none") to ask for a more comprehensive display: it allows you to print some text beside each event symbol (the text color being set by DisplayedTextColor). Here are the presets:
"nodur": prints the event nodur (as a phrase)
"index": prints the event indexes in the Ev array (ch:n)
"label": displays the event label (if any)
"score": prints the first line of score (if any)
"score nl": prints score line number ln (if any)
DisplayedText can also be "custom mode", or "custom" (same as "custom 0"). In that case, if a function called DisplayedTextIswith arguments (ch,n,mode) exists, its return value will be displayed beside the event symbol. You can then fully customize the information you want to have in the graphic area.
Note that the function GUIbackground() allows you to draw anything you want in the background of the graphic area. This way you can for example complete the way events are represented by adding custom graphics to the default symbols, in the spirit of the [A] button we just saw. See at the end of this chapter for details and examples.
Both functions (DisplayedTextIs() and GUIbackground()) should be defined in your userlib/GeoPostInit.k file.
A couple of macros are defined in lib/macros.k to quickly change the DisplayedText value. Here they are:
#define tisN		DisplayedText = "nodur";LastGMGUIf.redraw()
#define tisL		DisplayedText = "label";LastGMGUIf.redraw()
#define tisS1		DisplayedText = "score";LastGMGUIf.redraw()
#define tisS(l)		DisplayedText = "score "+string(l);LastGMGUIf.redraw()
#define tisI		DisplayedText = "index";LastGMGUIf.redraw()
#define tis0		DisplayedText = "none";LastGMGUIf.redraw()
#define tisC		DisplayedText = "custom";LastGMGUIf.redraw()
#define tisCn(n)		DisplayedText = "custom "+string(n);LastGMGUIf.redraw()
Display options
Next: the [display] button. It asks for names, I mean Names, global variables, separated with commas ",". If they are names of points, circles, segments, regions or pistes, these are displayed. If you give it names of lignes coming from a generator, then the tool looks at the "inter" or "rac" fields to display the appropriate content (See projector and data structure documentations for details).
If you type a "-" just before the name, the element is suppressed from the display.
Ex: "Or" will show the origin, "-Or" will hide it back.
Note that, as everything else in GeoMaestro, the display feature does not try to pretend being more clever than it is: so if you display twice a same point, then remove it once ("Or,Or,-Or"), it is still displayed once. This may seem stupid, but it all depends on what you want to do (you may have changed the points coordinates meanwhile and want to see how much it moved, for example), so you're the master of the display. More generally, let's say that the GUI does not try to impose its own automatisms to the user. When such an automatism is provided, there's generally an associated parameter variable allowing to desactivate it.
Also:
"--" removes every object from display
"-$p" removes all points
"-$i" removes all pistes
"-$c" removes all circles
"-$s" removes all segments
"-$r" removes all regions
"-$$" removes all selected objects
"-Ł" removes all lignes
Exemples of valid command for [display]:
--, Or, C1 clear everything, then show point Or and circle C1
-Joe, Joe hide Joe, then show Joe gain (whatever is Joe... but I guess it's something which value just changed, so we want to refresh the view)
Regions are displayed as a cloud of points. See RegDensity and FastRedraw in initialisations.k
If you want to display an array of objects, type a * before it's name. For example:
*ExPiste displays all points in the piste ExPiste, so that you can move them and change the piste,
... while ExPiste would display the piste itself, which can be selected or moved as a whole
This format is recursive: use several chained * to display inner fields from an array (like **ArrayOfPistes to display all points in an array of pistes)
There's a shorcut for refreshing a display (that is: hiding then displaying the same thing):
%Joe is the same as -Joe,Joe
... and a shorcut to remove all "ghosts":
=Joe is the same as doing -Joe as long as Joe is still around
To remove from display an arbitrary set of objects, you can also use {{ followed by a regular expression: all objects whose names contain the regexp will be removed:
{{a will remove all objects whose names contain "a"
{{\[ will remove all objects in arrays
This can be restricted to different types of objects by using {p, {i, {s and {c instead of {{:
{i[A-H] removes all pistes whose names start with A,B,C,D,E,F,G or H
{p_$ removes all points whose names end with _
... while {s refers to segments and {c to circles.
There is an history associated to the [display] button: enter ":?" to have a numbered list of the previous commands at the console, enter ":n" to recall command number n. Also, clicking of the small unlabelled button at the right of [display] recalls the last command. The history is stored in the array DISP, and it is dumped with the tool, so you can use it from a KeyKit session to another one.
Now there are two useful special syntaxes:
One is used to display lignes which have just been projected using the tool. You'll see later that these lignes are kept in an ordered list; so to display ligne number n you can use the internal name Łn (it is actually a shortcut for the real name RL[n] ), with a special syntax to access internal elements in the lignes: Łnc, Łna, Łnb, Łni... See here for a complete description.
The other one is used to define dynamic segments, that is: segment automatically generated and updated by the tool from two points. Let's say that points A and B are displayed; you can ask to see A-B. Now, if you select A with the mouse then move it somewhere else, you'll see that the segment A-B follows the motion. This is specially useful when used with the proj button (we're going to see that button right now). Note that you can ask A-B-C-D if A, B, C and D are existing points (not necessarily currently displayed, though). You will then have defined the three dynamic segments A-B, B-C and C-D.
Also, if P is a piste, P- will create and display as many dynamic segments as it is necessary for all the points in the piste to be linked (if P contains n points, this leads to the creation of n-1 new segments).
Important point here:
When something (point, segment, circle, whatever) is displayed in the GUI, it is always associated to both an internal variable and a global variable. The global variables are the ones displayed in the console when you click on the [display] button. You can use and manipulate these variables at the console in any way you want, but it will not change the value of the internal variable associated to the same object. So what you see in the GUI will not change unless you ask to hide and display again the concerned object, because hiding an object kills its internal implementation. But be careful: on the other way round, any change to an internal variable is immediately repercuted on the corresponding global variable. That's why when you move point A around in the GUI, global variable A follows the motion. So the basic rules are the following:
1) changes in the GUI have priority
2) if you want to change the value of an object at the console, it's safer to hide it from the GUI in the meantime.
Note that this is not true for events ! Events have one and only implementation, weither they appear on the GUI or not: it's the Ev array.
Second important point here:
When you dump a GUI, all its internals are dumped along. So reading a .kp page with a GUI in it restores even the global variables associated to displayed objects. But it does not necessarily restore objects you did not display. To be sure that an object you need or want to use later on is dumped with the tool, you must check that its name is an index of the GVARS array (to do so, the best is to give this command at the console: Notepad(GVARS, 1)). If it is not, use the RemVAR() function to register it. This function is automatically called by the GUI in a number of cases, so don't be surprised to see your object/variable already registered. But don't rely on this and manually register all important data ! (More about the GVARS array here)
Third (less) important point:
Now, concerning the special syntaxes for lignes and dynamic segments. This time, global variables are created to match what's on the sceen, and sometimes you may find them useful to use later on. For example, any ligne created by a projector in the GUI (go here to see how this happens) is stored in the global variable RL, which is an array. Let's say that in the ligne whose RL index number is 5 we're interesting in a certain circle that appears in the "inter" field of the ligne, at index 18. Sounds complicated, but it's simple ! (I can't emphasize enough how it's a good idea to use the Notepad() function to have a look at the way big arrays are arranged. In this case, if you have a few lignes stored in your GUI, try Notepad(RL) at the console)
We could display this circle by using its real name, that is: RL[5]["inter"][18]["cer"], or by the following shortcut: Ł5i18c
But we could also use the special shortcut: xŁ5i18c
Both give the same result in the GUI: the famous circle is displayed. But as you could see in this example by reading the console messages, the second method leads to the creation of a new global variable C_5i18c. This defines the very circle displayed on the GUI. As a consequence, you can now kill the ligne number 5 (which means that RL[5] will no longer refers to it) while keeping this circle at your disposal through its new name C_5i18c (of course, you can also rename it at the console !)
Also note that if by chance the variable C_5i18c did already exist (this could happen if you previously did the same kind of operation on another ligne that was temporarily stored in RL[5] ), then the new global variable will be named C_5i18cc ; if this one exists also, then it will be C_5i18ccc ,etc.. until an unused name is found. This allows you to regularly change the content of the RL array without loosing geometrical datas associated to rendered lignes. See in tutorial 2 how you can use this feature.
With dynamic segments it's more radical: this time a segment global variable is created for an object that didn't exist before. If A and B are existing points, displaying A-B leads to the creation of the variable S_A_Bwhose value will be actualized every time you move A or B at the GUI. But when you stop moving them or hide the segment from the tool, you can still use S_A_B for that segment. (Beware that is A and/or B are arrays elements, the segment name will be modified so that brackets do not appear in it: "[" is replaced with OBra__ while "]" is replaced with CBra__, whose values you can get at the console.)
Ok, back to the display options topic:
The [grid] button lets you toggle between six types of background representations:
- no axes
- axes only (x=0 and y=0)
- axes and broad rectangular grid (units)
- axes and precise rectangular grid (0.1 units)
- axes and broad polar grid
- axes and precise polar grid
The polar grid center is the point CentrePolaire, defined in initialisations.k (you can change it at the console, it will take effect at the next redraw)
The [size] button changes the size of the symbols representing points and events.
The [snap] button toggles between free positioning mode and stick-to-grid mode. In the last one, the mouse will tend to stick to the displayed grid lines, if it's close to them. Note that in both modes, clicking close enough to an event symbol or a point does the job. Try and see, it's the best way to understand the mouse behaviour.
The [proj] button provides the most powerful display option: it sets the mode for showing how projections are done on a given segment or circle. So by simply looking at the screen you will have a precise idea of the way events are going to become notes in a phrase.
The button is again a toggle between four modes: no projection displayed; all projections displayed (in red); all projections displayed (in a different shade of green for each segment); only projections of selected events displayed (in a different shade of green for each selected event). At the moment there's no way to select a specific support object: projections will be displayed on every displayed segment or circle.
Let's see how it looks like on an exemple:
Here's the Ev scene (a few events on two differents channels) with three points A, B, C and the dynamic segment A-B-C
The [proj] mode is: show nothing.
Now we click once on [proj], and here is what we get:
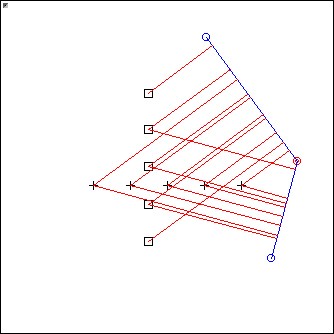
The red lines are all the projections that would happen if we used the Ecoute() projector on the two segments.
(we have also selected the point B in this exemple; that's because we're going to move it):
So let's move B (with the "move selection" mouse mode) and click on [proj] again (just for fun):
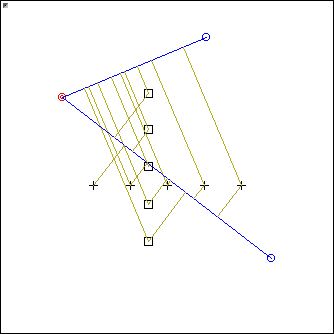
The two dynamic segments have been updated, so the projections are completely different now. Also, there are two shades of green, one for each segment, but it's not really obvious here (this feature is more useful when many segments are presents).
Finally, let's select a couple of events and click [proj] again:
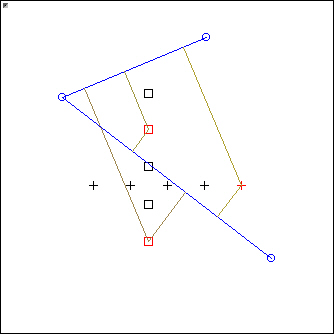
... we now only see the projections from these events to the segments.
To finish with the display options, we have the [zoom ..] buttons: their function is trivial ! Just play with them, that will do the documenting job !
Projections
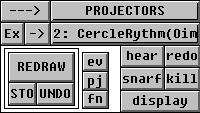
Here are the buttons available when the GUI is set in the projections mode:
First line: two buttons for projecting
the button here labelled PROJECTORS is a menu button which allows you to choose a projector among the registered ones (see advanced features for registering a home-made projector)
Once this is done, the [--->] button at the left actually performs the projection. You will be asked for the arguments required by the projector (with the help of the console which reminds you what they are).
Syntax: what you give here will be used as is in the projector call. So arguments must be separated with commas "," but can be any kind of valid KeyKit expressions and global variables.
(Moreover, you can use a global variable not defined yet ! This is useful if you suddenly decide that you want to play with an argument values. So you can give a variable name instead of a fixed value. Then the projection will not be performed, and you will be asked at the console to define the variable. When it's done, just click on [redo] to perform the projection.)
Note: if you selected the first item ("PROJECTORS"), you'll have to give a complete projector call; this lets you use non registered projectors from within the GUI. The only difference being that you won't have any help about the type and meaning of the required arguments.
There is one special syntax available here, but first let's see the other buttons:
Second line: managing the rendered lignes calculated by projections
The result of the projection is a ligne. It will be indexed and stored in the RL array. Items from that array are directly accessible from the second menu button we have here: the one labelled "2: CercleRythm(.." in the above image. Let's call this button the RL button.
So you have here all the lignes you produced by a projection from the GUI, with an id number and the actual command used to create them. If no lignes are there yet, "group: -" is displayed. This "group:" line is always present: it is used to indicate which of the following lignes are "grouped" together. By default, they are all in the group.
The other buttons apply either on the currently selected ligne (the one appearing in the RL button, RL[2] in our example), or to the whole group (if the first item of the menu is selected):
[hear]: click here to hear the phrase in the selected ligne (R(2]["ph"] in our example), or to stop the realmidi task. If the group is selected, you will hear the corresponding phrases either merged (|=) or added (+) accorded to the group order, depending on the value of the grouping mode (see below for more)
The parameter TocTocToc sets the amount of time (in clicks) spent before the phrase is actually played. By default (sets in intialisations.k), it's 1 seconds. This is an important parameter as the bang() method for the GUI is the [hear] button action (see tutorial 3 for more)
If AnimInLignes is set to 1, you will also see the projections at the same time as you hear the rendered notes; also, at the console, the corresponding information will be displayed: time, event channel and number, nodur and distorted nodur. However, this mode makes calculations much slower, so by default it is not enabled. You can change the value of AnimInLignes on the fly at the console, but then you may need to redo projections (see just below) in order for the "anim" information to be present in the lignes.
[redo]: re-calculates the ligne (or the group), using the same command(s). You may have changed a point, circle or segment position, or the value of a variable, or the Ev scene itself, so you can refresh the projection this way.
Note that fast recalculations are possible when you changed only the nodurs of existing events and/or some distortion functions settings, but this involves generating large lignes, so it is not enabled by default: see the usage of parameter ProjInLignes for more about this.
[snarf]: puts the phrase from the ligne (or from the group) into Snarf. If a Csound score is present in the ligne, it is written in the file CS_SnarfFile; and if the parameter ShowScoreWhenSnarfed is 1, the text editor defined for Notepad() opens at this point and displays the score.
[kill]: erases the current ligne (or the current group of lignes), and recalculate ids for the remaining ones. Be careful about possible conflicts if you're using the RL array somewhere else, since the lignes indexes are going to change. Relative references inside the RL group are correcly updated, though. (In general, it's not a good idea to rely on the RL group for programming, since it is subject to changes. It should be considered as a temporary storage for rendered lignes. See tutorial 2 for examples)
[Ex]: sets the group and the grouping mode:
First, you're prompted for the group: if you just press RETURN, it doesn't change. Otherwise, you can use the following syntax to select lignes from the RL array and group them together:
"-" no specific group (all the lignes are in the group)
"1, 5-10, 25, 30-32" lignes 1,5,6,7,8,9,10,25,30,31,32 in the group (in that order)
"1, 10-5, 25, 30-32" lignes 1,10,9,8,7,6,5,25,30,31,32 in the group (in that order)
Then you're prompted for the grouping mode. It sets how commands related to the whole group will be executed. Basically, "add" will take the lignes in the group in the corresponding group order, "merge" will treat them in parallel, and "array" will consider each one of them independently from the others.
Typing "0" (arrange) does not really set a grouping mode: it simply arranges the whole RL array according to the group value: all lignes that are not in the group are killed, lignes in the group are re-ordered and re-indexed, relative references being taken into account and updated. Then the group is set to "-".
If you simply press RETURN, the grouping mode stays the same.
[->] : this button lets you choose among different ways to export the selected ligne (or the group). Different formats are proposed, press RETURN until you get the one you're interested into. Here they are:
- ligne exported as a global variable, (give a variable name)
- phrase (from ligne "ph" field) exported as a global variable, (give a variable name)
- phrase (from ligne "ph" field) exported as a midi file, (give a root name, file name will be MDOP+root+".mid")
- ligne exported as a KeyKit function (returning the ligne) in a .k file (give a function name, it will be saved in the COMPOS directory)
(The default value for MDOP and COMPOS are set in the initialisations.k file)
When the whole group is exported, the grouping mode defines the following:
- "array": global variable will be an array (of lignes or phrases), midi files will be called MDOP+root+(index number)+".mid", KeyKit function will return an array of lignes
-"add" or "merge": same formats as for a single ligne, which will be built from the group according to the mode
tutorial 2 is the place to look at if you want to see some of this used within an example composition.
Note that the grouping feature only provides very simple and limited ways to combine lignes. The Compositor Tool helps creating much more complex and large compositions.
OK, now let's see the special syntax in the projector arguments: as you now know (at least I hope so !), a ligne is a specific data format: it's an array containing, along with the musical phrase rendered by the projection, many other useful informations. For example, if you used the projector Onde, which takes as projection supports a set of N circles regularly defined between two given circles C1 and C2, the resulting ligne contains the coordinates for all these circles.
As I said before, you can display this information with the Ł syntax (which is actually a shorcut to navigate in the RL array of "R"endered "L"ignes). This same syntax can be used here to take intermediary circles or points as arguments in a projector call; you've got to be aware of the difference between absolute or relative mode. The syntax for relative mode is the following (we take ligne 2 as an exemple):
Ł2c refers to the last (or only) circle of ligne 2 (shortcut for RL[2]["rac"]["cer"])
Ł2s refers to the last (or only) segment of ligne 2 (shortcut for RL[2]["rac"]["A"]-RL[2]["rac"]["B"])
Ł2a refers to the starting point of the last segment in ligne 2 (shortcut for RL[2]["rac"]["A"])
Ł2b same for the ending point (shortcut for RL[2]["rac"]["B"])
Ł2d is the starting time of ligne 2 (shortcut for RL[2][0])
Ł2fis the ending time (shortcut for RL[2][1])
Ł2i5c refers to the fifth intermediary circle (shorcut for RL[2]["inter"][5]["cer"])
Ł2i17a refers to the starting point of the seventeenth intermediary segment (shorcut for RL[2]["inter"][17]["A"])
Ł2i17i5a refers to... guess what ? Yes, you can have nested "inter" arrays, depending of what operation the projector does (so here it's a shortcut to RL[2]["inter"][17][5]["A"])
etc...
In the projector call, such shortcuts will be replaced by the reference in the RL array they point to, as you can see in the above example. But you can also choose an absolute referencing by simply putting a "x" before the Ł: "xŁ"; as it is the case with "xŁ" in display, any request using the xŁ shorcuts leads to the creation of a new global variable which make it much more handy to later manipulate the point/segment/circle it refers to. The console displays a message giving the name of this variable. For example, using xŁ2i5c gives birth to the circle variable called C_2i5c, which is really easier to use than the original array element called RL[2]["inter"][5]["cer"]... Other names start with S_ (segments), I_ (integers), or P_ (points). But remember that these variables are not pointers: if you change the RL array or redo a projection, they will not change ! While relative references not only get updated when you redo a projection, but also when you kill lignes or re-arrange the RL array.
Channels management
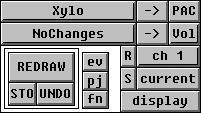
Here are the buttons available when the GUI is set in the channels management mode:
Here you can set the options for every channel in GeoMaestro. The [ch n] button is a menu button selecting the current channel n, the [current] button displays at the console the current options for channel n.
The button labelled "Xylo" in the picture is a menu that should display your patchmap (the one you see in the KeyKit "prog change" tool. See here for more). Choose here the instrument you want to associate to channel n, and click on the arrow button beside to perform the association. If you want to give a specific "PAC" that is not in the patchmap, use the [PAC] button and enter it at the prompt (don't forget it's a phrase: ' ' are required).
Below, the button labelled "NoChanges" is another menu giving access to the registered distortion functions, which are the fonctions used to change the nodurs depending of distance, etc... during the projection. The "Vol" button is again a menu button: you can toggle between Vol, Pit, Dur, Tim, Pan, Mer and Sco (for CScore). The middle arrow button performs the associations. When you click it, a pop-up windows asks for function specific parameters, which usage is described at the console. Give a list of parameters, separated by commas, or type "-" to use the default parameters. If instead you simply press RETURN, the operation will be canceled.
I know this is very short of an explanation (well, ok, there's no explanation at all), but you simply need to read this and it will hopefully become crystal clear. See also tutorial 5.
The small [S] and [R] buttons are used to respectively save and read whole sets of distortion functions settings (that is, precisely: the arrays Volume, Pit, Dur, Time, Pan, CScore and Mer with their associated argument lists arrays). For saving, just give the root name of the file: settings will be saved in DEFDIR+root name+".df" (DEFDIR is by default DATA, you can set its value in the initialisations.k file)
Note that you're not restricted to the registered distortion functions: these are simply the ones available from the GUI (see also the ChooseDF plug-in). Nothing prevents you from using the console to directly set the contents of the Volume, Pan, Dur, Time, Pit and CScore arrays, in the same way as you can directly change the content of the Ev array. Again, the GUI is only an interface to easily work on the GeoMaestro functions and data structures; don't think that everything you can do can be handled from the GUI, as this is far from being true.
We're done with the graphic tool ! So:
- To see what are the principles, syntax and properties of the projectors, go here
- To have a presentation of the data structures for GeoMaestro (including Ev and lignes), go there
- To read a short tutorial on a basic example, go there
- To see what are the console and programming commands of GeoMaestro, go here
- To discover how you can use the lignes resulting from projections in a larger composition, see the documentation about the Compositor Tool
- To listen to music actually composed with GeoMaestro, go there
-- Back --